A quick reminder that Advanced Analytics is available as an add-on for Enterprise plans only.
Below is a list of all the things you can track with Advanced Analytics:
Use the following metrics to track how individuals and teams are using Templates across the organization:
|
|
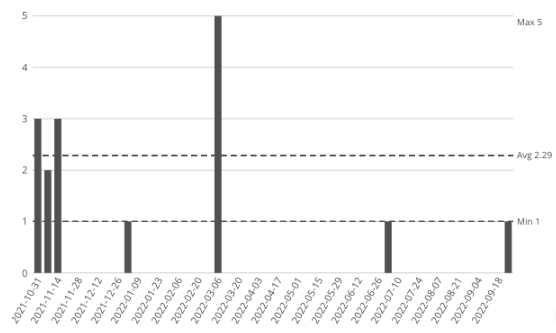
Projects created from templates Bar: The total number of new projects created by users Line: the total number of unique templates that were used to create projects (i.e. if template “A” was used to create projects “1”, “2”, and “3” - it would be counted once) |
|
|
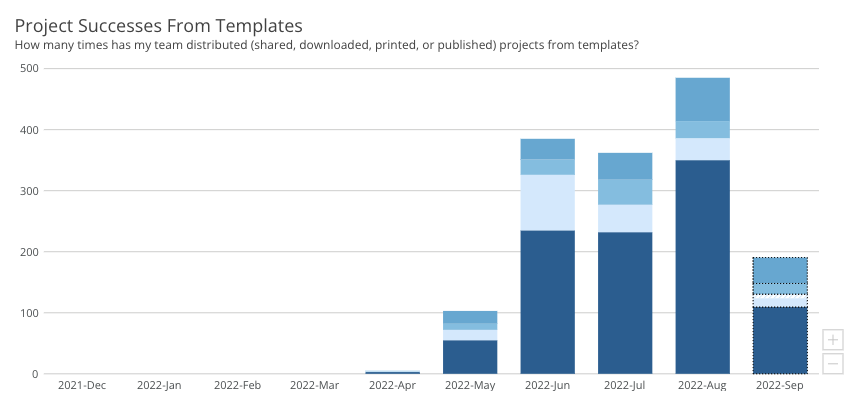
Projects successes from templates
2. Templates utilized: The percentage of templates that have been used for projects or shared, downloaded, printed, or published 3. New templates created: the number of new templates (personal or brand) that have been created in a certain timeframe 4. Templates updated: The number templates (personal or brand) that have been edited in a certain timeframe |
|
|
Project Activity from Templates Filters can be used to gain more insight on activity trends for either user groups or template categories. |
|
|
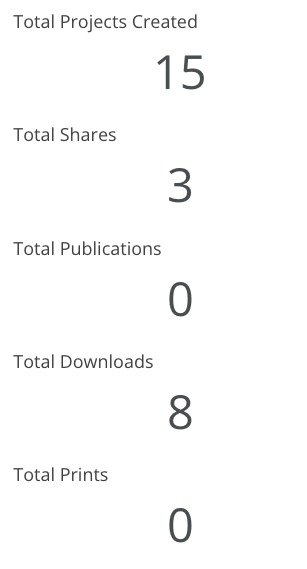
Project Activity Top Level Metrics Timelines: New Template & Recent Template Updated: by default the time period is but can be filtered to a desired date range when expanding/opening a report. Downloaded: The total number of new projects created by users Shared: The total number of times a user adds a new user or group to collaborate (see definition of Publish in Glossary section below). Published: The sum of all events that include published to various channels like “publish to web”, post to Facebook, publish to email, etc. (see definition of Publish in Glossary section below). Printed: the number of times a user requested a print order through Marq’s print order flow. |
|
|
Projects Created by Template Category NOTE: if your templates have multiple template categories, they will be counted once in each category. I.e. if a project is created from “Template A” (which has 2 categories: “Social Media: Facebook” & “Campaign: Winter Discounts”) both categories and category groups would have 1 project attributed and thus overall numbers across all groups should not be used to know the total # of projects created for your account. Timeline: by default the time period is “last 12 months” but can be filtered to a desired date range when expanding/opening a report. |
|
|
Least Popular Template Categories Timeline: by default the time period is “last 12 months” but can be filtered to a desired date range when expanding/opening a report. |
|
|
Template Adoption Over Time by Category NOTE: if your templates have multiple template categories, they will be counted once in each category. I.e. if a project is created from “Template A” (which has 2 categories: “Social Media: Facebook” & “Campaign: Winter Discounts”) both categories and category groups would have 1 project attributed and thus overall numbers across all groups should not be used to know the total # of projects created for your account. SUGGESTED TIP: Filter by a specific template category group to see trend amongst that group. I.e. filter by the inner circle in the “Projects Created by Template Category” or in the top “Template Category Group” filter dropdown. E.g. Category Group = Social Media Type -> see trends on which types of templates are used the most of all social media templates. Timeline: by default the time period is “last 12 months” but can be filtered to a desired date range when expanding/opening a report. |
|
|
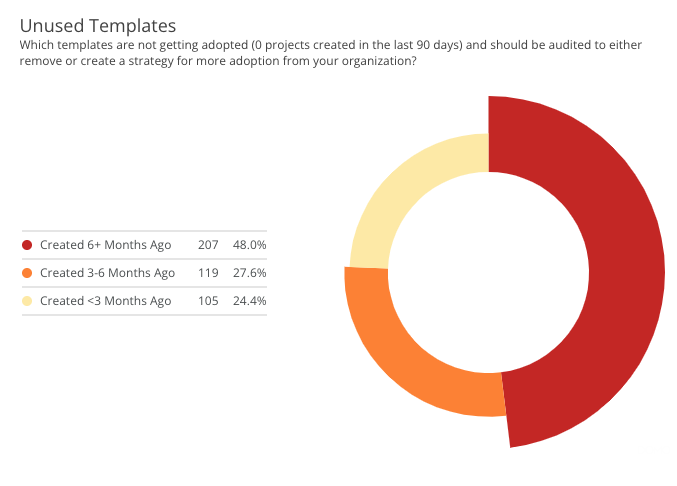
Unused Templates SUGGESTED TIP: Filter the table report to the right, Unused Templates that Need Audit”, by clicking on the created “bucket” to see those specific templates (e.g. click on the red “created 6+ months ago” to see templates created over 6 months and no projects generated from those templates) |
|
|
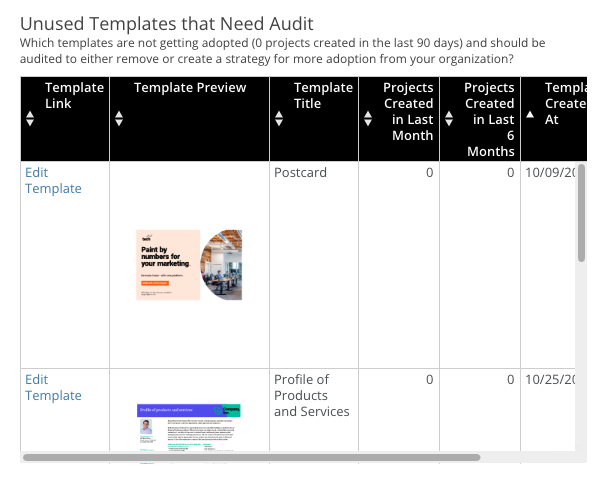
Unused Templates That Need an Audit Timeline: by default no time period is set but all templates are ordered by creation date |
|
|
Projects created from personal templates Timeline: by default no time period is set but all templates are ordered by creation date |


Analytics Admins can drill down into specific templates to gather even more insight. Here’s what that looks like:
|
|
Template Preview |
|
|
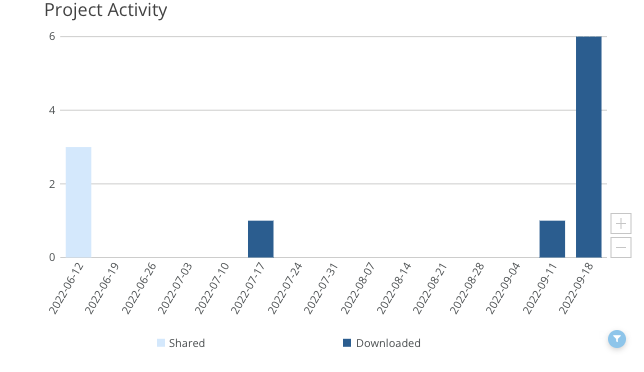
Projects successes from templates Timelines: by default the time period is “all time” but can be filtered to a desired date range with the date filter in the top portion of the dashboard. Downloaded: The total number of new projects created by users Shared: The total number of times a user adds a new user or group to collaborate (see definition of Publish in Glossary section below). Published: The sum of all events that include published to various channels like “publish to web”, post to Facebook, publish to email, etc. (see definition of Publish in Glossary section below). Printed: the number of times a user requested a print order through Marq’s print order flow. |
|
|
Projects Created from Template |
|
|
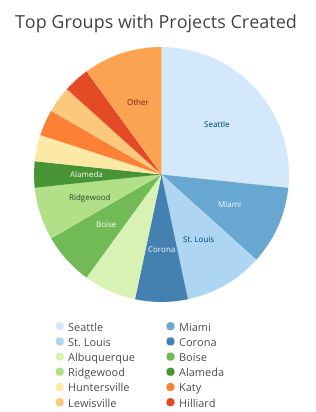
Top Groups with Projects Created Filtered to the top 25 user groups. NOTE: if a user is a part of two groups, each group will receive a count for a project that has been created and the report is meant to compare groups against each other. Timeline: by default the time period is “all time” but can be filtered to a desired date range with the date filter in the top portion of the dashboard. |
|
|
Top Users with Projects Created Timeline: by default the time period is “all time” but can be filtered to a desired date range with the date filter in the top portion of the dashboard. |
|
|
Project Activity Over Time Any time a user downloads, shares (adds a collaborator), prints, or publishes a project a new “event” is created for the specific template. Timeline: by default the time period is “all time” but can be filtered to a desired date range with the date filter in the top portion of the dashboard. |
|
|
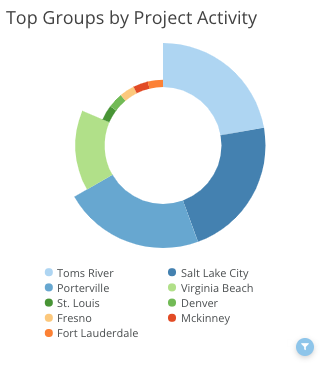
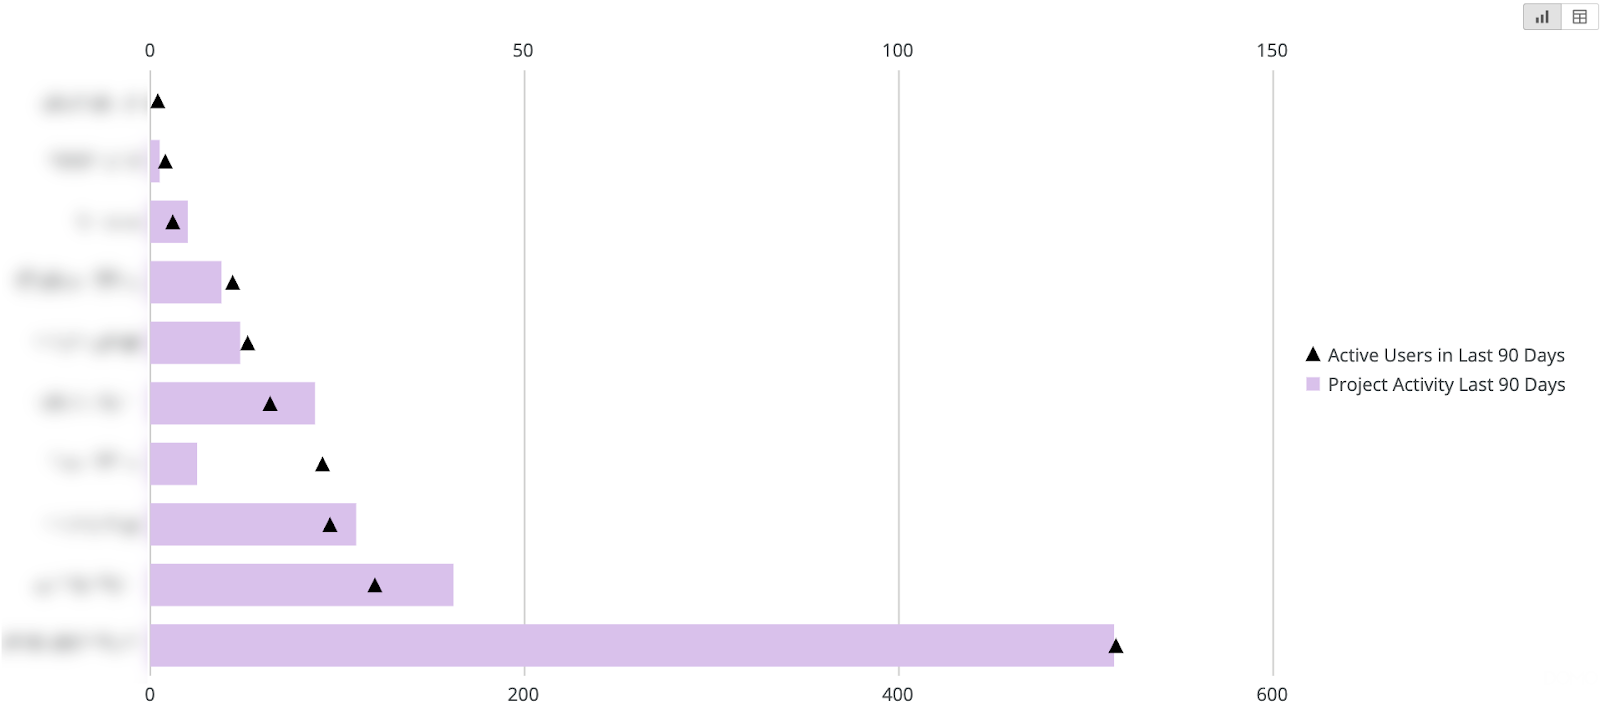
Top Groups by Project Activity The highest number of project activity (shares/downloads/prints/etc.) by users that are a part of a user group. Filtered to the top 25 user groups. NOTE: if a user is a part of two groups, each group will receive a count for a project that has been created and the report is meant to compare groups against each other. Timeline: by default the time period is “all time” but can be filtered to a desired date range with the date filter in the top portion of the dashboard. |
|
|
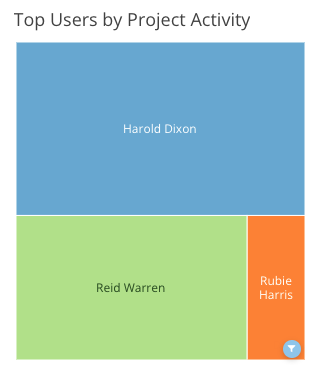
Top Users by Project Activity The highest number of project activity (shares/downloads/prints/etc.) by user. Filtered to the top 25 users. Timeline: by default the time period is “all time” but can be filtered to a desired date range with the date filter in the top portion of the dashboard. |


Analytics Admins can track platform usage to identify common trends, measure product adoption, and pinpoint platform super users.
|
|
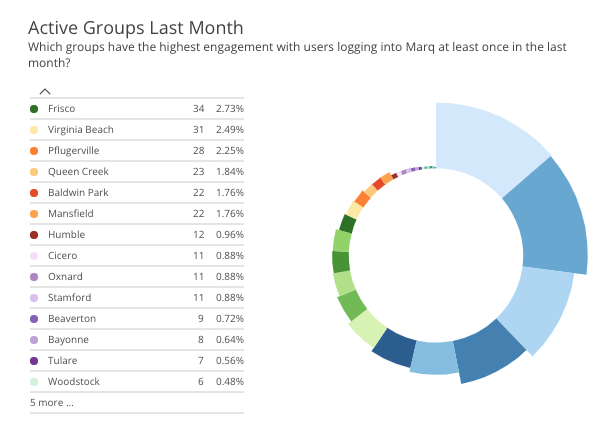
Active Groups Last Month NOTE: if a user is a part of multiple groups, both groups will receive a count to their total number of users if the user has logged in. Filter out groups by using an exclusion filter in the top level dropdown if needed. |
|
|
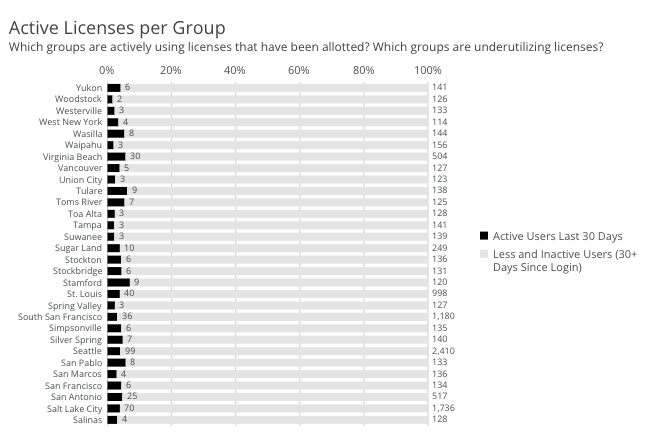
Active Licenses per Group |
|
|
Least Engaged Groups Blue symbol: the number of users that logged in at least once in the last 90 days. Limited to the 25 groups with least engagement Sorted by Projects Created first; then sorted by Active Users second for tie-breakers |
|
|
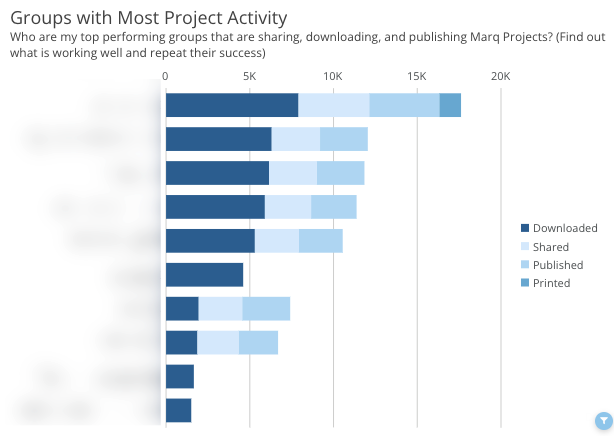
Groups with Most Project Limited to the 25 groups with most engagement Sorted by total combined activity Timeline: by default the time period is “all time” but can be filtered to a desired date range with the date filter in the top portion of the dashboard. |
|
|
Average Project Activity Timeline: by default the last 12 months from today by each month |
|
|
Most Active Users by Project Activity Limited to the 25 users with most engagement Sorted by total combined activity Timeline: by default the time period is “all time” but can be filtered to a desired date range with the date filter in the top portion of the dashboard. |
|
|
Active Users (30 days, 90 days, 6 months) |


Teams that have an approval process in place can track how efficient their process really is. Approvers can also quickly access a full list of projects that are pending approval.
|
|
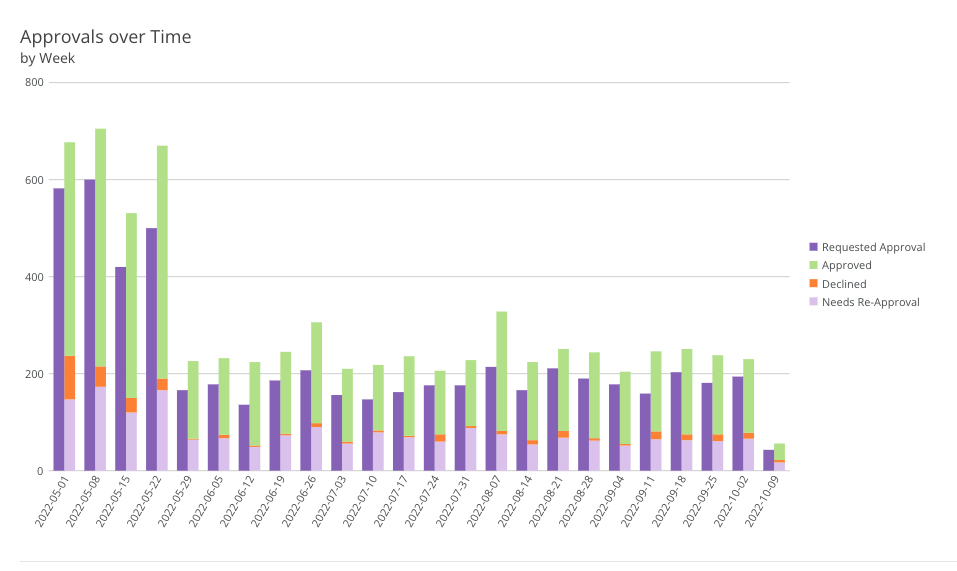
Approvals over time |
|
|
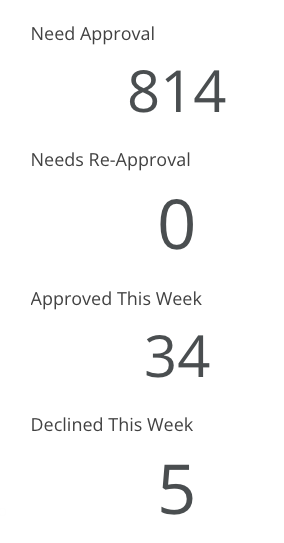
Project approval metrics 1. Need Approval 2. Needs re-approval 3. Approved this week 4. Declined this week |
|
|
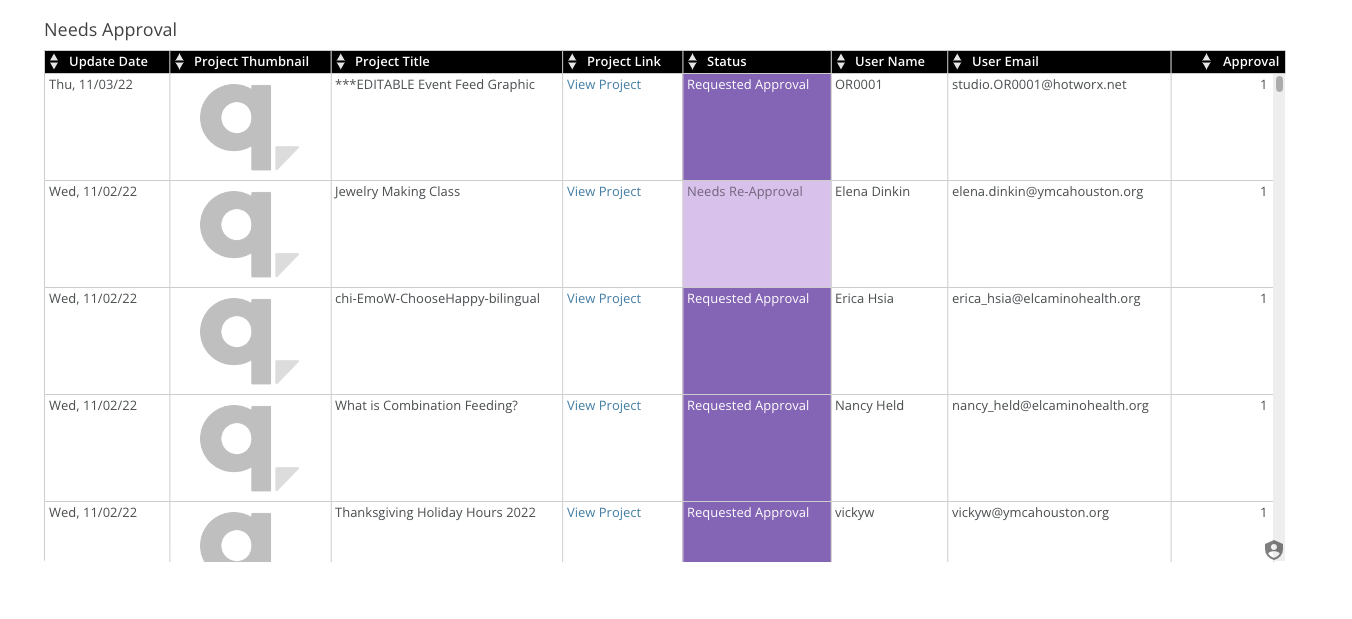
Projects that need approval |
If you’re interested in getting a deeper look at Advanced Analytics for your Marq Account, please contact your Marq account manager or reach out to support@marq.com