There are a number of ways you can drill down into reports to gather more data. Below we outline how you can do that.
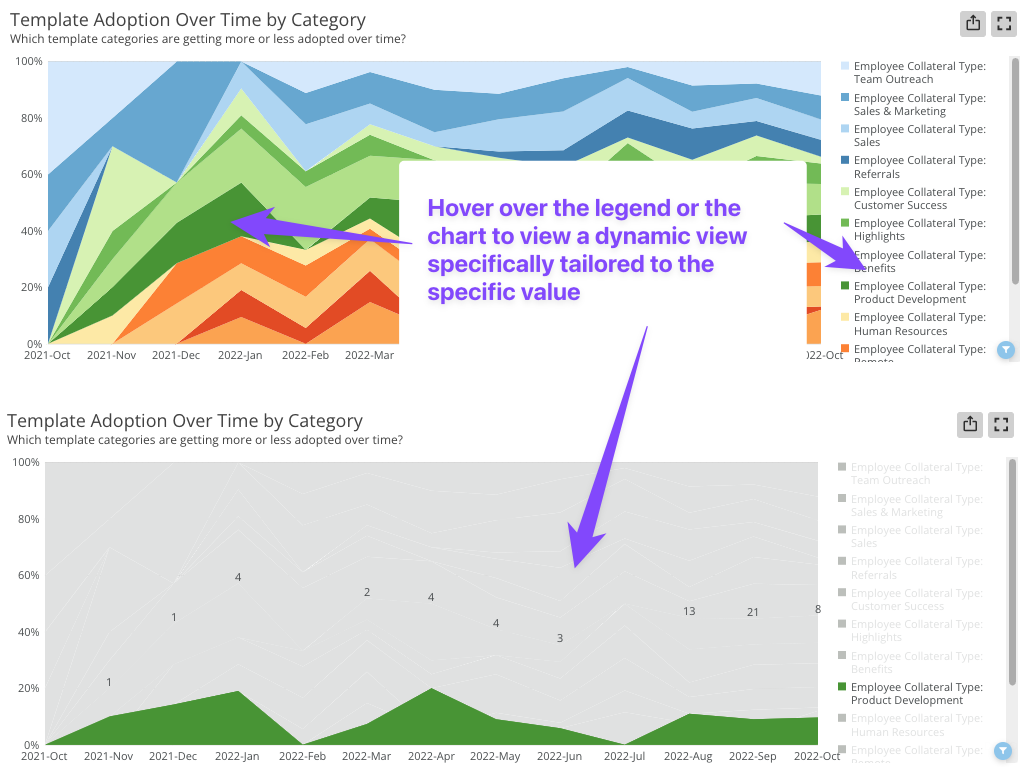
Hovering: Whenever you are viewing a report on a dashboard, you can either hover over the chart itself to highlight that portion, which will often provide hover details (like the number or % specific to the section you are hovering); or you can place your mouse over the legend section of the report as well
Note: Remove a date filter from a report by clicking on the “back” arrow
Expanding

Note: Remove a date filter from a report by clicking on the “back” arrow
Drilling Down

Note: Remove a date filter from a report by clicking on the “back” arrow